


Written by Alexander Larsen CFIRM, IRM Energy SIG Chair & Ghislain Giroux Dufort MIRM, both of Baldwin Global
 The Institute of Risk Management recently released a thought leadership document based on a survey of the Energy industry. As part of the survey results, there were a number of articles contributed and featuring in the final report.
This was one of the featured articles. To download your own copy of the publication, please CLICK HERE for the IRM site
How much appetite for risk does your organisation have to achieve objectives or seek new challenges? Are staff and managers aware? are the senior management team or board even aware? Is the organisation ready to reach for the stars?
Some organisations operate in high risk environments (think SpaceX, Virgin galactic and NASA) whilst other less so. No matter the industry however, establishing risk appetite and tolerance levels (and monitoring over time the actual risk profile against them) is essential to the long-term success of any organisation, whether in the energy industry or other sector of activity.
When discussing risk appetite, people tend to think of bland and non-informative risk appetite statements, or overly quantified and financial risk appetites. Both of these have limited value and often restrict risk taking rather than allow risk taking. In many cases space travel, air travel or other high risk activity should not be possible according to risk appetite statements. How can we expect to achieve great things and remain competitive with such appetite statements?
Looking at the high-level risk appetite statements, they are nearly always:
A) Too broad to gain any significant use out of the statement
- How can decisions realistically be made from a statement such as we “will not accept any risk that affects our reputation”?
B) Rehashes of the corporate objectives or taken from other targets such as HSE accident rates
- An organisation could have endless risk appetite statements that would allow no risks to be taken if this was the case.
C) Inconsistent with objectives
- How can an energy company operate in an environment where a risk appetite statement says “we will not accept project delays of x” or “we will
not accept loss of life.” The nature of the business is projects and delays, while operating in countries such as Iraq or Afghanistan goes against “we will not accept loss of life”. The statements are too broad and lack detail or real decision-making value.
D) Never change
- Once an organisation sets a risk appetite statement, they rarely change, and why would they? It’s a very high-level statement that can only be written in a small number of ways.
E) Don’t consider the risks
- The risk appetite statements we have seen are almost exclusively linked to objectives, which doesn’t take into account the actual risks or opportunities that the organisation faces.
Most organisations struggle with putting together even the high-level type of risk appetite statements. They often spend a lot of time and resources on trying to perfect high-level statements that don’t provide much decision- making value, or on overcomplicating the statements, which again leads risk appetite to being ineffective.
In this article we highlight a methodology that provides decision-making value to quantified risk appetite statements by linking corporate objectives to leading key risk indicators (KRIs) established at the source of risks that may affect the achievement of those objectives. This approach provides a warning system that increases the chance that organisations may take action before risks materialize as well as ensuring that organisations are not spending too much money over controlling risks. In other words, allowing them to take more opportunity or spend the money more wisely elsewhere!
Objectives v risk
While the whole point of risk management is to identify and manage risks to the objectives, risk appetite statements tend to focus solely on objectives, for example aspirations of zero accidents or deaths. Risk appetite therefore ends up driving risk identification rather than the risks driving the risk appetite.
Assume an organisation has 5 key objectives, and 5 major risks. Once targets and acceptable deviations relative to targets have been set for key objectives, how does
the organisation manage to minimize the chances of deviating from key objectives? The answer is to focus on the major risks to key objectives and to set risk appetite statements for these risks rather than only on objectives. Assuming that risks change more often than objectives, we can also expect the appetite statements to change more frequently too.
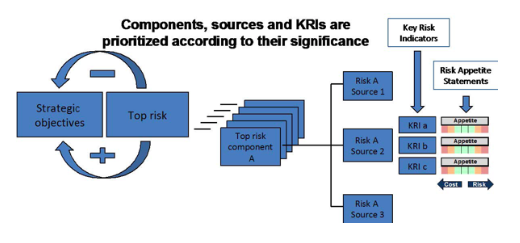
One other major benefit of linking appetite to risk is that we can actually map the risk through to the relevant key risk indicators (KRIs) with individual risk appetite ranges for each KRI as shown in Figure 1 overleaf.
Figure 1: Baldwin Global’s Key Risk Indicator and Risk Appetite Model
How to set risk appetite and key risk indicators in your organisation
In our experience, high-level risk appetite statements based on each major risk can be put together in a half-day workshop with management teams. Detailed quantified risk appetite statements based on KRIs established at the source of risks will require some
more time depending on the nature of the risk and availability of data and expert opinion. It is important to run workshops rather than setting these statements in isolation. Not only does it ensure everyone is aware of the risk appetites, but there is the added benefit of increasing risk knowledge and building a positive risk culture while also gaining a variety of views and experiences to develop the appetite statements.
Of course, when setting statements, it is important to consider the wider implications for the organisation. Rather than setting a figure for what is acceptable in terms of accidents or deaths for example, AirSafeCo, the fictitious airline company example below in Figure 2, decided to look at improvements to long term trends and focus on not accepting an increase in the trend. This presents a more sensitive approach to safety risk and its management over time, rather than having an “acceptable” number of casualties or fatalities.
In addition to the general risk appetite statement written in Figure 2, more specific and quantified statements should be established based on leading key risk indicators linked as closely as possible to the source of the risk. Figure 3 illustrates such a statement for AirSafeCo’s three top components of Safety Risk: Crash, Turbulence and Tarmac delays.
Figure 2: AirSafeCo’s General Risk Appetite Statement
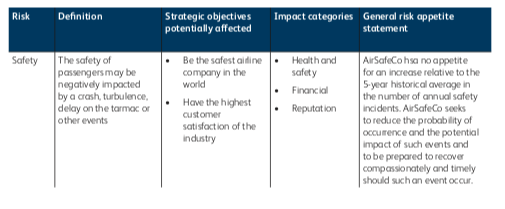
Figure 3: Examples of KRIs and how to build a risk appetite linked to them
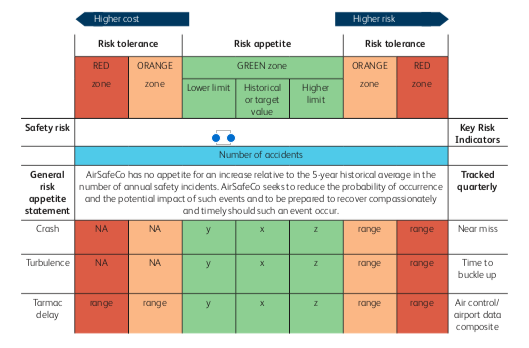
The Green Zone represents the quantified risk appetite for each risk component: the amount of risk the company is willing to accept in order to achieve its objectives.
The Orange Zone represents the first level of tolerance and may require, for example, an investigation into the reasons for this deviation. The Red Zone represents the highest level of tolerance where immediate action is required. More risk tolerance zones may be inserted to provide various levels of analysis and/or action. Leading KRIs of crashes might be, for example, near miss events. In turn, one could then search for leading indicators of near miss events, and so on. Each industry and company should find or create leading KRIs that are causally correlated to their key risks and linked to their impact on corporate objectives.
Risk workshops may provide expert opinion on KRIs and appetite and tolerance levels. But having the right data to validate those opinions is essential too, and it is therefore important to understand what the components and causes of risks are, in order to understand what information is required. As an example, for an oil & gas facility in a sensitive area, the risk of “major loss of life” could come from a terrorist attack, major accident or natural disaster. Once you have identified the components and causes of major risks, KRIs can be established which allow individual risk appetites set at their source.
Also note that Figure 3 is two-sided: the right side indicates positions of increasing risks, while the left side indicates positions of reducing risks – but at an increasing cost. Since risk management is not free, trade-offs may have to be made when deciding on risk appetite and tolerance, and the cost of managing a risk to its appetite and tolerance can also be monitored using this approach.
How does this help decision-making and risk reporting?
One of the roles of risk management is to enable boards of directors and senior management to make better strategic decisions. Too often, organisations limit themselves to reporting risks independently, through risk registers and heat maps. This is very limiting and often out of date. Additionally, risks rarely change significantly which means the top 3 or 4 risks (in terms of likelihood and impact) are discussed at length whilst the others get missed. What should be done is to integrate risk assessment and reporting within business cases for decision making purposes.
Figure 4: Example of Risk Reporting based on Appetite
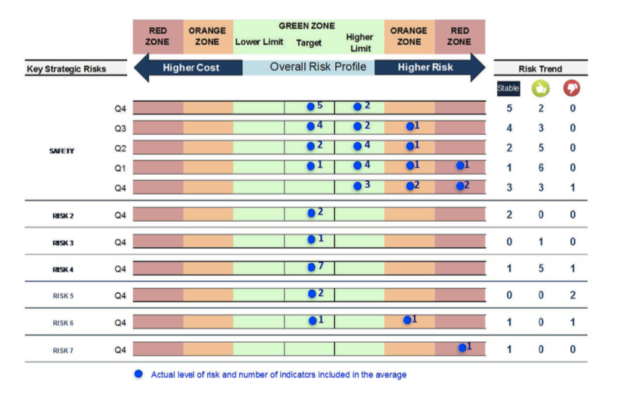
As we have seen earlier, risk visualisation is a far more effective method of viewing risks for decision-makers, offering an alternative view of what the top risks might be. The approach to risk appetite and KRIs that we have so far discussed offers yet another alternative to the traditional risk register approach to reporting. It provides real-time snapshots of the status of risks to the business and a perspective on their trends. The top three to four risks on most risk registers are usually very well managed, and senior management would be better off discussing the other risks that might be less well managed. A visually effective reporting template allows for such focus on relevant risks and is demonstrated in Figure 4 above.
Looking at the reporting example in Figure 4, the output from the KRIs and the related risk appetites shows clearly which risks are most pressing. Senior Management and the Board would be able to tell quickly which risks are within their appetite and which ones lie outside their appetite or tolerance levels. A focus on the last five quarters of Safety risk shows that KRIs have gradually improved over time towards the Green Zone, a sign that enhanced safety risk management has paid off in this example.
Conclusion
Whether they operate in the field of transportation, energy, or any other sector, including not-for-profit ones, organisations need to take risks in order to achieve their objectives and to thrive.
In the words of Sir Richard Branson, “Unless you risk something, the world stands still”, something which his Virgin brand always seeks to do (Changing the world) from space travel to hyper look and hyperspeed travel to greener air travel. “We take a lot of calculated risk, but we make sure that no one risk is going to topple everything. Protecting the downside is critical”
Where risk appetites and tolerances have already been determined, it is counterproductive to be over-managing risks. One of the unique aspects of this approach to risk management and reporting, aside from focusing on risks that really need attention, is that it also exposes risks which may have too many controls and where resources would be better spent elsewhere.
